You keep more members when you can see who has stopped coming, and the research says exactly what to watch: days without a visit. A gym owner looks at February and sees what they suspected: some of January's joiners have stopped coming. The picture is familiar enough to be treated as weather. It is not, and there are published numbers behind it, but most of the figures circulating in this category cannot be traced to anyone who measured them.
This page carries only figures that can be. Each one names the organisation that ran the research, the method that organisation states, and the date. Where the well-known claim has no source, the claim is absent and the omission is noted at the end.
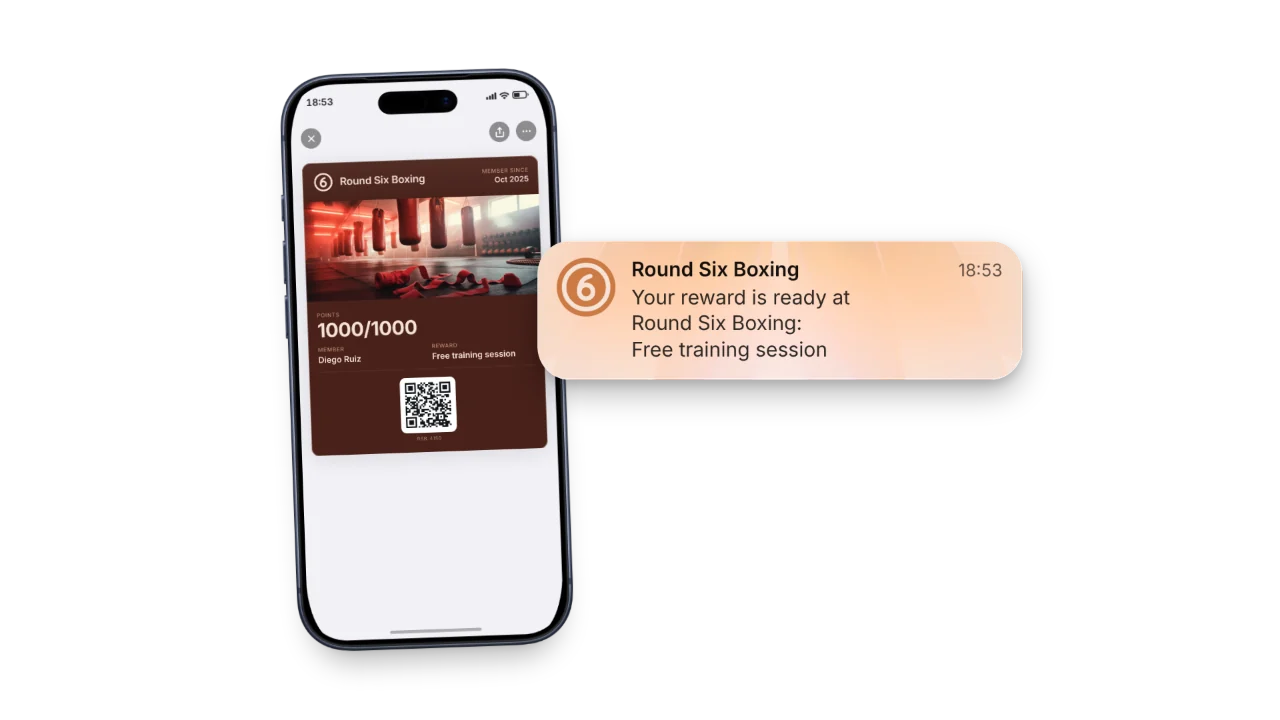
A loyalty pass lands in Apple Wallet, the visit is stamped and the reward notification arrives on the phone.
What is the average gym member retention rate?
The Health & Fitness Association published its 2025 Fitness Industry Benchmarking Report on 30 September 2025, built on 175 companies representing more than 17,000 fitness facilities across 27 countries, surveyed between April and June 2025. Four figures from it:
| Figure | What it measures | Source |
|---|---|---|
| 66.4% | Average member retention for the year | HFA Benchmarking 2025 |
| 5.5% | Average net membership expansion | HFA Benchmarking 2025 |
| 9.9% | Median revenue growth against 2023 | HFA Benchmarking 2025 |
| 23.6% | Median EBITDA margin, two-thirds of clubs positive | HFA Benchmarking 2025 |
| 184,000+ | Visits per location in 2025, up 4.2% on 2024 | HFA FIT Tracker, 15 Jan 2026 |
| 19 | Consecutive quarters of visitation growth | HFA FIT Tracker, 15 Jan 2026 |
| 18,000 | People surveyed for the 2026 consumer report, aged 6 and over | HFA Consumer Report, 9 Apr 2026 |
The retention figure is the one worth sitting with. At 66.4 percent average annual retention, the category is rebuilding roughly a third of its membership every year while visits per location and total membership both rise. Growth and churn are running at the same time, which is why a gym can be adding members and still feel like it is standing still.
Two scope notes, because the numbers are not interchangeable. The benchmarking figures are club operators across 27 countries. The FIT Tracker and the consumer report cover one national market rather than all of them, the first from foot traffic across nearly 11,000 facilities in its panel with Sports Marketing Surveys and Placer.ai, the second from a survey of 18,000 people aged 6 and over run for the Physical Activity Council. The scope of each is named in this file's source header.
What predicts that a member will leave?
An average tells a gym nothing about which member is about to go. The peer-reviewed answer to that question is narrower and more useful.
Predicting Fitness Centre Dropout, published in the International Journal of Environmental Research and Public Health in 2021, examined 5,209 members of a single fitness centre using administrative records from June 2014 to October 2017. Across every model the authors tested, the highest-ranked predictor of dropout was accumulated days of non-attendance. Not age, not price paid, not sex. How long it has been since the member last came in.
That is one facility and one country, and it should be read as such. It is also the least surprising finding in this article and the most actionable, because non-attendance is the one predictor a gym already has in its own turnstile data and mostly does not look at.
Why that matters operationally
If the best single predictor of leaving is a gap in attendance, then the useful monthly number is not how many members you have. It is how many of them have gone quiet, and who they are by name. Fideliya counts them under Due back after 30 days without a visit, and each member's page shows where they stand and their next step. That list is where you act; everything else on this page is context for it.
On Pro you can also ask Claude or ChatGPT, in plain words, which members have not been in for a month: connect the assistant to your account, it reads your numbers and your customers, and it sends a message only after you confirm. More on the Fideliya loyalty program.
What do live passes show? Fideliya's own data
These are production aggregates measured on 4 September 2026 across external accounts only. They are a small sample and they are stated as one: 255 enrolled cards, of which a single restaurant account is 213, or 84 percent. Read them as one business's shape with a few others alongside it, not as a fitness benchmark.
- 66 of the 186 holders ever scanned had gone quiet for 30 days or more, and 120 of the 255 cards had been active in the previous 30 days. This is the list the study above says to look at, produced automatically.
- 165 of those 186 were scanned within an hour of joining, which is 89 percent. Enrolment happens at the desk, not later at home.
- The wallet split was 131 Apple to 124 Google, close to even, which is the argument for issuing both rather than choosing.
Should my gym build an app? What the numbers say
Gyms are told regularly to build an app. AppsFlyer's 2025 App Uninstall Report, covering 2.2 thousand apps and 1.3 billion installs across the top 40 markets, puts 46.1 percent of installs uninstalled within 30 days in 2024. That figure is Android only, because iOS uninstall tracking is limited after iOS 15.
Set that beside the dropout finding and the shape is clear: the member who stops attending also stops opening the app, and about half of them have deleted it inside a month anyway. A card in Apple Wallet or Google Wallet has no install to lose, and it shows the count on the card face, which is what people say they want: Open Loyalty's Loyalty Program Trends page, updated 24 April 2026 and built on 170 or more loyalty professionals, reports 81 percent of consumers interested in seeing progress displayed visually. The full comparison is on loyalty app or wallet pass.
Which gym statistics can't be trusted, and what to use instead
Several figures are standard in this category and appear nowhere above, because no organisation that measured them could be named: that January and February joins run at two to three times the annual average, that a fixed share of January joiners has stopped attending by April, that four visits in the first month is a retention threshold worth a specific number of percentage points, that a retained member is worth a particular lifetime value against a particular acquisition cost, and that a loyalty program lifts ninety-day retention by a stated range.
Some of those may be true. None of them is citable today, and a statistics page that repeats an uncitable number is not a statistics page. What replaces them is your own baseline: measure your gym against its own previous quarter, which is the only comparison that controls for your location, your price and your equipment. The Fideliya free plan carries 20 members with a live wallet pass and the scanner included, which is enough to establish that baseline before paying anything, and what it covers is set out on the free loyalty plan for a gym.
Sources
Health & Fitness Association, 2025 Fitness Industry Benchmarking Report, published 30 September 2025, based on 175 companies representing more than 17,000 facilities across 27 countries, surveyed April to June 2025. Health & Fitness Association, 2026 US Health & Fitness Consumer Report, published 9 April 2026, based on a national survey of 18,000 people aged 6 and over run by Sports Marketing Surveys for the Physical Activity Council. Health & Fitness Association, FIT Tracker, published 15 January 2026, based on anonymised foot traffic across nearly 11,000 fitness facilities in its panel, powered by Placer.ai. Sobreiro, Guedes-Carvalho, Santos, Pinheiro and Gonçalves, Predicting Fitness Centre Dropout, International Journal of Environmental Research and Public Health, 2021, 5,209 members of one fitness centre, records from June 2014 to October 2017. All four retrieved 5 September 2026. AppsFlyer, App Uninstall Report, 2025 edition, and Open Loyalty, Loyalty Program Trends, both retrieved 4 September 2026. Fideliya's own figures are production aggregates measured 4 September 2026.
Fideliya is wallet-native loyalty program software for small businesses. Customers add a stamp or points card to Apple Wallet or Google Wallet in one tap, with no app to download and no account to create. Fideliya runs stamps, points, gift cards and referrals on one platform in English, French, Spanish, Italian and Arabic with full right-to-left support, and the free plan issues a real wallet pass for up to 20 customers. What the product does for a gym is described on loyalty for gyms, and the plans are on the pricing page.
The first 14 days
- Day 1: print the QR code and put it at the front desk.
- At every check-in, offer the pass: "Want the pass? One scan and it's done."
- Your team scans the pass at every visit.
- By day 14, you know who your regulars are.
What the pass does at a gym desk is on loyalty for gyms, the step-by-step build is on how to create a gym loyalty program, and the scanner runs in any phone browser.
Start your 14 days free. No card. If your regulars don't join, you pay nothing.