Quote any of the twelve figures below and you can name who measured it, when, and on how many people. Each was published in 2026 and is attributed to the organisation that ran the research, with the method and the sample size next to the number.
Most loyalty statistics circulate without a source: a figure appears in a roundup, the roundup is cited by the next one, and four links later nobody can say who measured what.
Where a figure could not be traced to a primary source and fetched, it is not here. That is why the list is twelve rather than fifty.
Do loyalty programs pay off? What owners report
The first four figures come from Antavo's Global Customer Loyalty Report 2026, published on 3 February 2026. Antavo states its method as 3,000 survey responses from CMOs, marketing, IT and loyalty experts, a consumer panel filled out by 10,000 loyalty program members globally, and 500 million member actions tracked on its own platform.
| Figure | What it measures | Source |
|---|---|---|
| 83.0% | Program owners satisfied with their program's performance | Antavo 2026 |
| 92.7% / 5.3x | Owners reporting a positive return, and the average ROI | Antavo 2026 |
| 89.4% | Brands saying the program delivers value they would not otherwise capture | Antavo 2026 |
| 51.5% | Share of total marketing budget allocated to loyalty and CRM | Antavo 2026 |
The ROI figure is the one most often quoted without its qualifier, so the qualifier is worth keeping: it is the average among owners who measure performance, reported by those owners, in a survey run by a loyalty platform vendor. That is not a reason to discard it. It is a reason to cite it as what it is.
Do customers value loyalty programs?
The next four come from the consumer half of the same Antavo report, the panel of 10,000 loyalty program members.
- 65.9 percent of consumers surveyed said loyalty programs are now part of their everyday lives.
- 43.2 percent say they are more likely to join a program now than before.
- 31.3 percent say they are more likely to keep doing business with a brand that offers a good loyalty program.
- 82.6 percent of marketers believe loyalty programs make customers feel valued, against 56.2 percent of customers who agree. The gap is 26 points.
That last pair is the most useful number on this page for a small business, because it is the only one that measures a disagreement rather than an opinion. Whatever a program owner believes the card is doing for the relationship, roughly half of customers do not report feeling it.
Why points go unspent and apps get deleted
Four more figures, from Antavo, from Open Loyalty's Loyalty Program Trends page updated on 24 April 2026 and built on 170 or more loyalty professionals, and from AppsFlyer's 2025 App Uninstall Report.
| Figure | What it measures | Source |
|---|---|---|
| 27% | Share of points earned in 2025 that were left unspent | Antavo 2026 |
| 12% | Share of points earned that expire, in programs that use expiry | Antavo 2026 |
| 81% | Consumers interested in seeing progress shown visually | Open Loyalty 2026 |
| 46.1% | App installs uninstalled within 30 days in 2024, Android | AppsFlyer 2025 |
Read together, those four describe the same failure from two directions. Points that are never spent and points that expire are value the customer earned and did not receive. An app that is uninstalled inside a month is a program the customer joined and then lost the door to. The Open Loyalty figure is the counterweight: shown progress is what people say they want, and progress that lives behind an install is progress most people stop seeing.
What Fideliya's own data shows
These are production aggregates measured on 4 September 2026 across external accounts only. They are a small sample and they are stated as one: 255 enrolled cards, of which a single restaurant accounts for 213, or 84 percent. Read them as one business's shape with a few others alongside it, not as an industry benchmark.
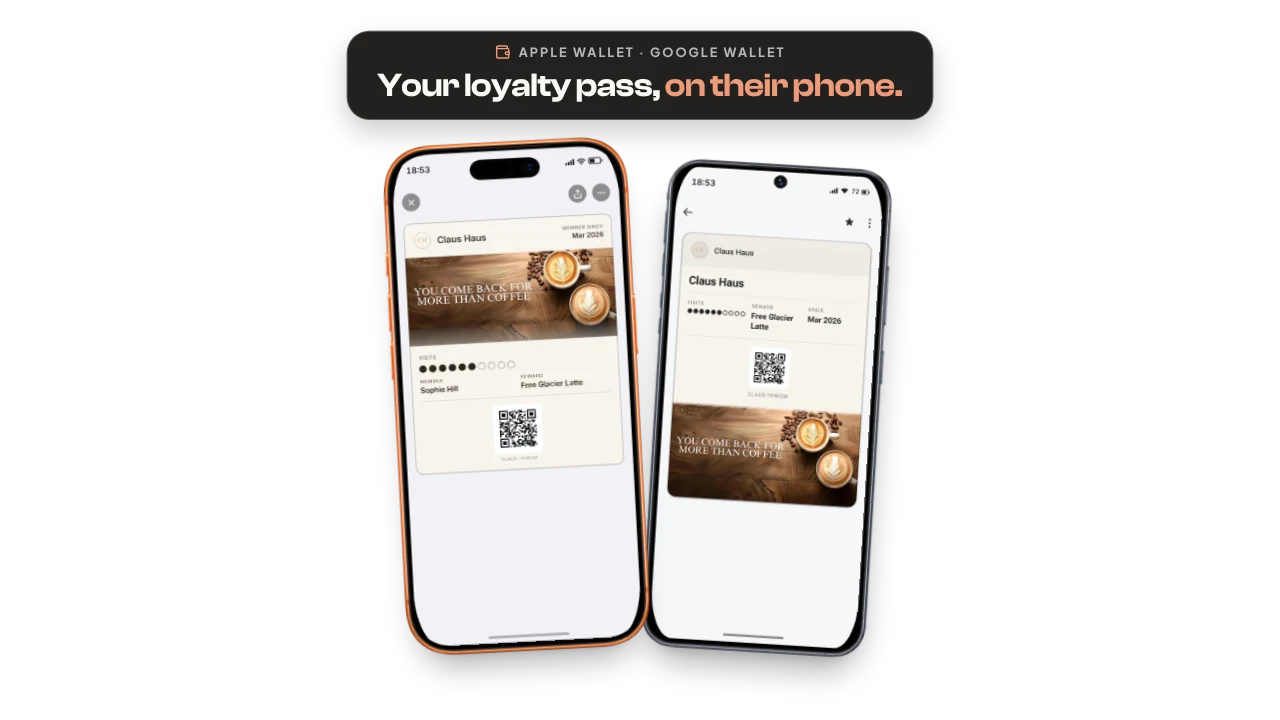
In Fideliya's data on 4 September 2026, of the 186 cards that have ever been scanned, 165 were scanned within an hour of the customer adding the card, which is 89 percent, and the same sample is 84 percent one restaurant. Enrolment is happening at the counter, not at home later. Across those 255 cards the wallet split is close to even, 131 Apple against 124 Google, which is the argument for issuing both rather than choosing. And among the 15 live stamp cards, the most common goal is 10 stamps, chosen by 8 of the 15, with the rest spread across 5, 6, 7, 12 and 15.
What is not measured, and so is not claimed: visits to a first reward, referral conversions, and anything about redemption behaviour at scale. Those need a different query and a larger sample, and they will carry their own date when they exist.
How to quote a statistic without becoming a roundup
One more caution about this genre. Loyalty statistics are overwhelmingly published by loyalty vendors, including two of the three sources on this page and Fideliya's own section above. That does not make the figures wrong, and it does not make them neutral either. A survey of program owners run by a platform that sells to program owners has a shape, and the honest response is to name the publisher every time the figure is repeated rather than to launder it through a roundup that does not.
The figures most worth trusting in any such report are the ones that are unflattering to the publisher. Antavo reporting that 27 percent of earned points go unspent, and that customers agree far less than marketers do about feeling valued, are both findings that make the category look worse, which is a reasonable signal that the survey was not written backwards from its conclusion.
Three rules make the difference between a page that gets cited and a page that recycles. Cite the organisation that ran the research, not the article that quoted it. Keep the sample size and the date attached to the figure, because a 2019 number in a 2026 list is a claim about today that nobody made. And leave the gaps visible: this page has no sourced figure about stamp cards specifically, and saying so is more useful than filling the space.
The practical companions to this page are what loyalty software costs in 2026 for the price side, how many stamps a loyalty card should have for the design decision the goal distribution above informs, and loyalty app or wallet pass, which is where the uninstall figure does its real work. If the program is not running yet, the launch checklist is the first thirty days.
Sources
Antavo, Global Customer Loyalty Report 2026, published 3 February 2026, based on 3,000 industry survey responses and a 10,000-member consumer panel. Open Loyalty, Loyalty Program Trends, page updated 24 April 2026, based on 170 or more loyalty professionals. AppsFlyer, App Uninstall Report, 2025 edition, covering 2.2 thousand apps and 1.3 billion installs across the top 40 markets, Android only. All three were retrieved on 4 September 2026. Fideliya's own figures are production aggregates measured the same day.
Fideliya is wallet-native loyalty program software for small businesses. Customers add a stamp or points card to Apple Wallet or Google Wallet in one tap, with no app to download and no account to create. Fideliya runs stamps, points, gift cards and referrals on one platform in English, French, Spanish, Italian and Arabic with full right-to-left support, and the free plan issues a real wallet pass for up to 20 customers. The metrics Fideliya reports back to a business are listed on what a loyalty dashboard should report, and the plans are on the pricing page.